A habit tracker with statistics and charts
Whether you count a habit in repetitions, minutes or a quantity
OpenHabitTracker is a free, open source habit tracker that also holds your notes and tasks. It runs on Windows, Linux, macOS, iOS, Android and in a browser, with no ads and no account.
Open a habit and it can show five charts of its own history.
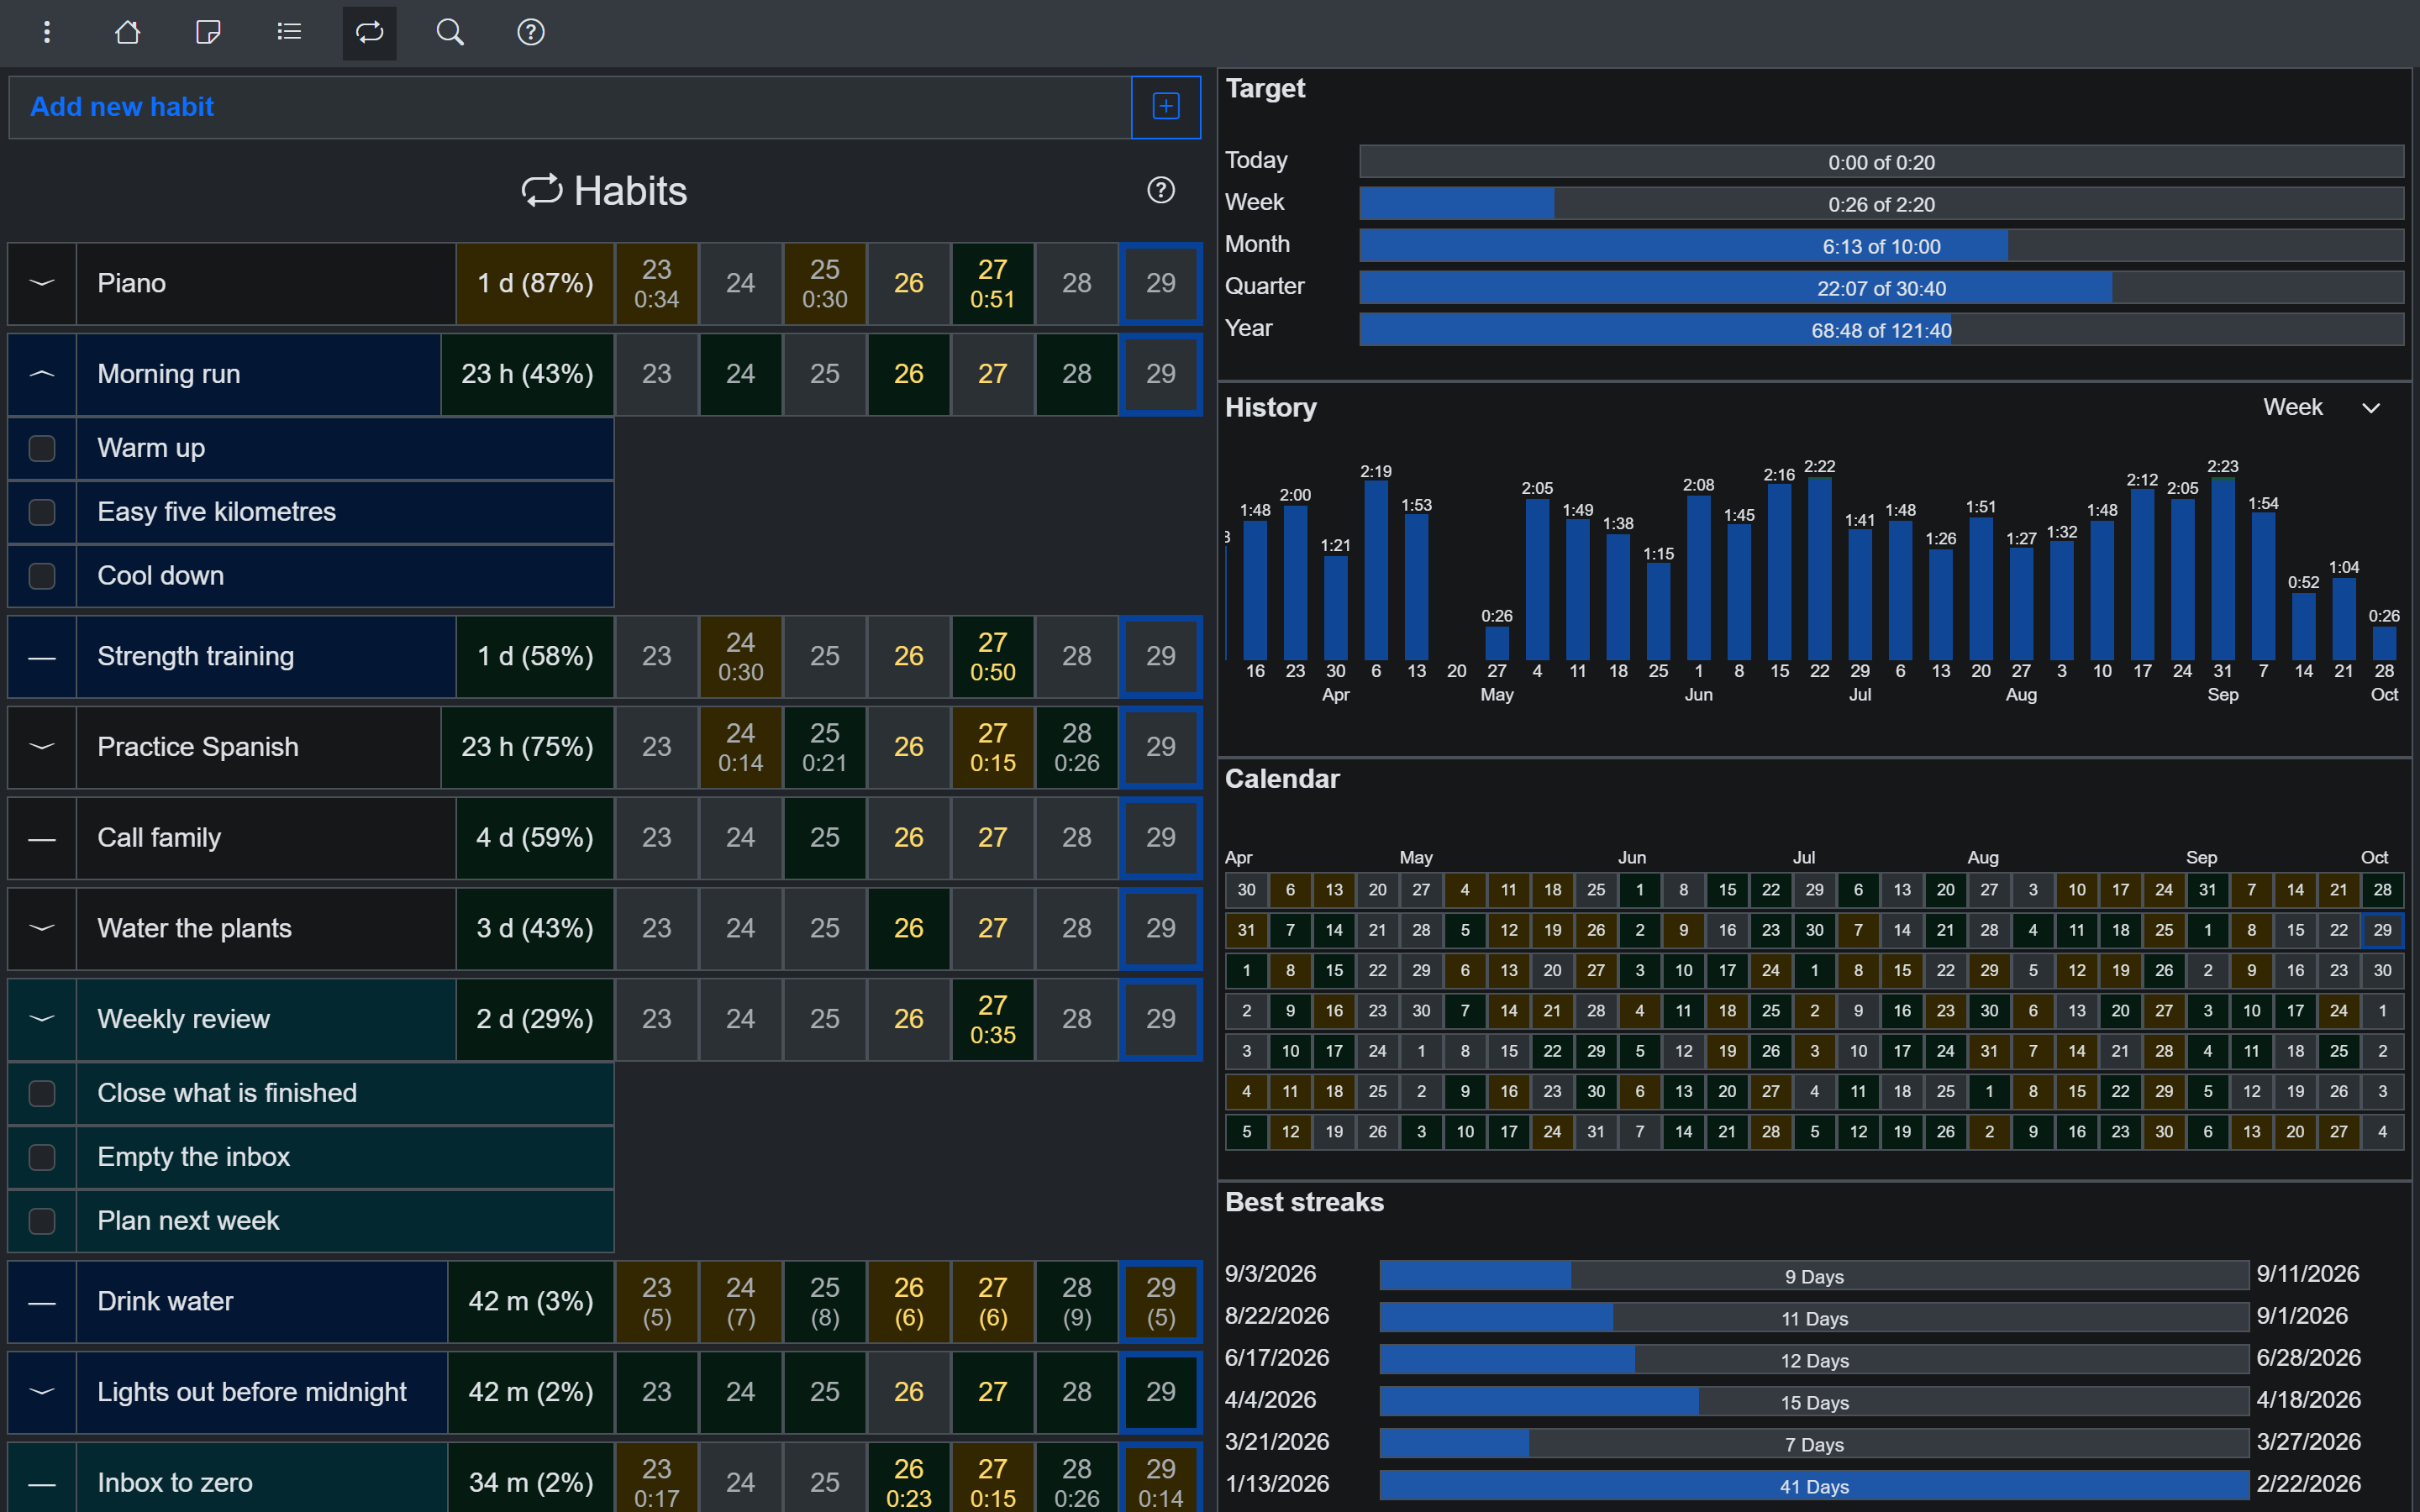
Target, history and calendar for 20 minutes of Spanish a day
Progress toward the target
The first chart has five bars: today, this week, this month, this quarter and this year. Each window is measured against everything it asks for, so 20 minutes of Spanish a day asks for 2:20 in a week and 10:00 in a 30-day month, and the bar shows how much of that is done.
Anything done beyond what the habit has asked for so far is drawn in green, so a week that is ahead of schedule looks different from one that is merely on its way.
History
A bar chart of how much was done in each day, week, month, quarter or year, with the newest on the right. It opens one step coarser than the habit repeats, so a daily habit starts on weeks and a weekly one on months, and you can switch to any of the five.
Each bar is compared with what its own period asked for, and the part above that is green.
A calendar without breaks between months
Every day of the past year in one continuous grid, reaching further back if the history does. A day is colored the same way as in the habit's month calendar: green when that day's target was met, amber when something was done but not enough.
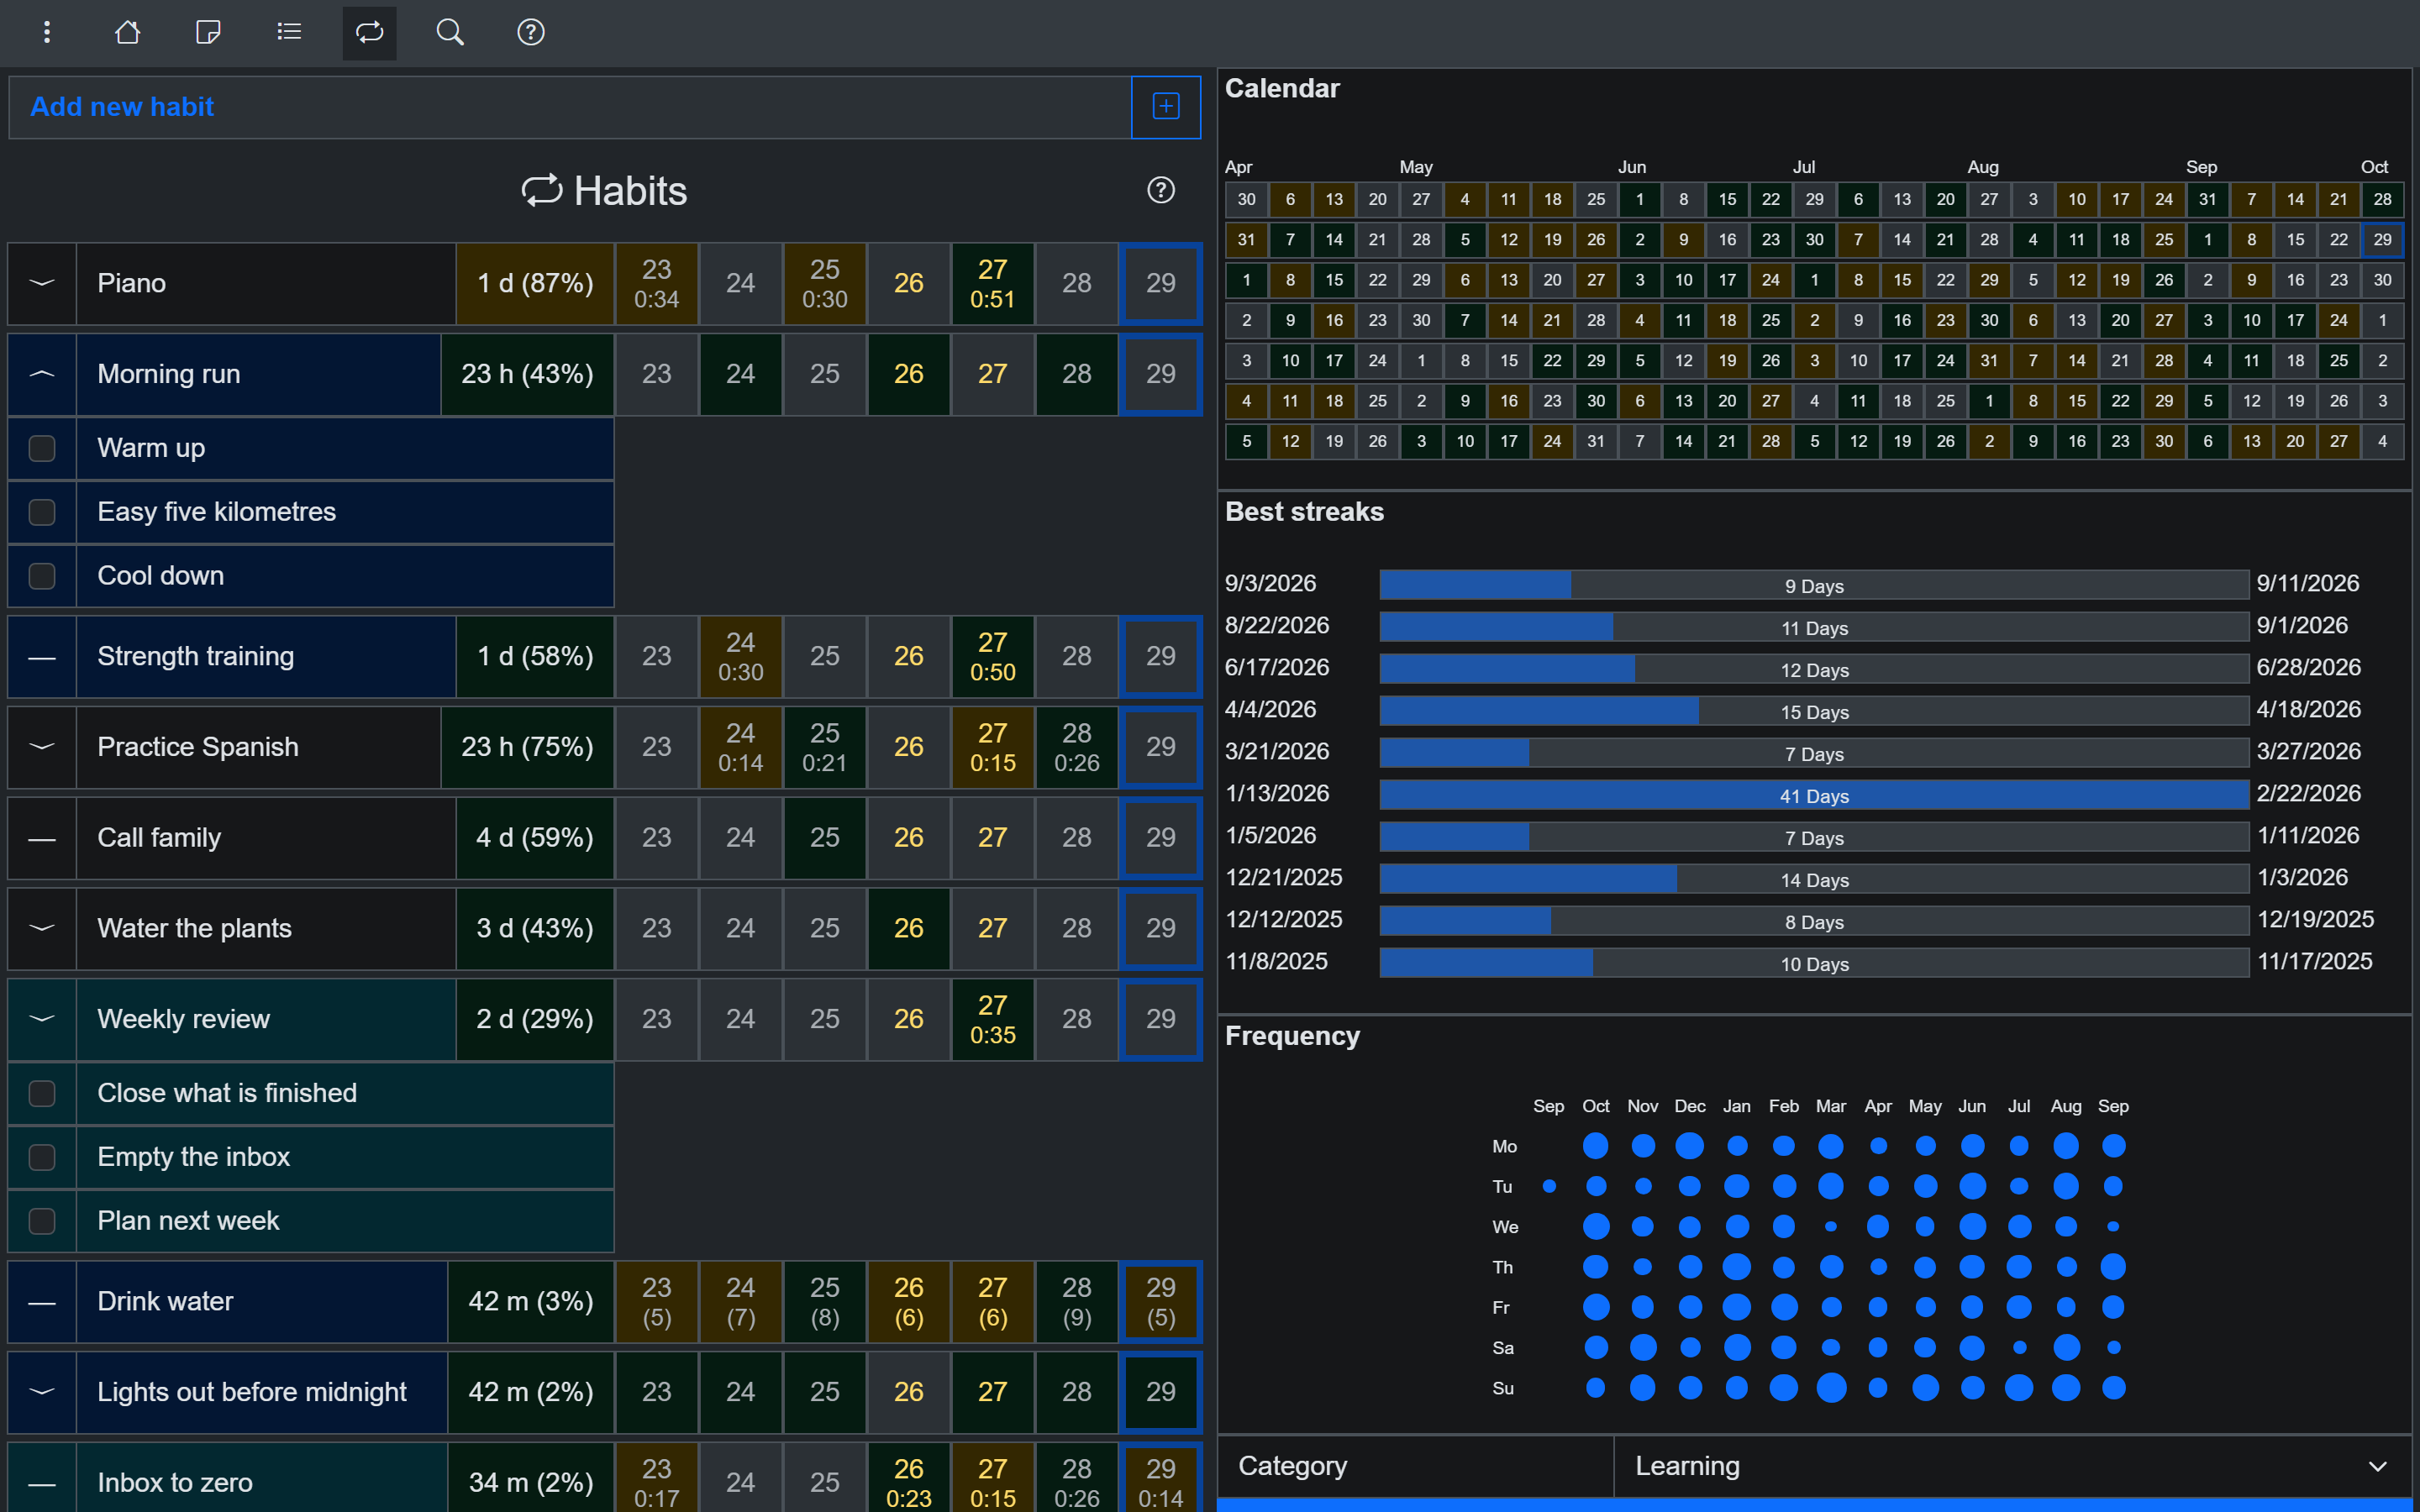
Calendar, best streaks and weekday frequency
Best streaks
The ten longest streaks the habit has had, newest first, each with its start date, its length and its end date. A streak is counted in the habit's own period, so a weekly habit has a streak of weeks and a monthly one a streak of months.
Which weekday it gets done
A table with a row for each day of the week and a column for each month. The bigger the dot, the more was done on that weekday in that month, and every cell also carries its value as text for a screen reader.
Repetitions, time or quantity
A habit is measured in repetitions, in time spent, or in a quantity you set a target for, and every chart uses the same measure. A time habit shows hours and minutes in its target, its history and its weekday table, and a quantity habit shows the sum of what was entered.
Weekly statistics beside every list
Next to the habit list, a weekly panel counts the habits that are on track, due soon and overdue. The task list gets the tasks done and overdue with the time spent, and the notes list the notes created and updated.
The habit's own page can also show a statistics block: the current and best streak, the total and average time spent, the elapsed time, the repeat interval, the average interval, and the ratios between them.
Turning them on
The charts and the statistics block are two separate settings, both off by default, so the habit page stays a short form until you want more. They are saved, sync between your devices if you self-host, and are included in JSON and YAML backups.
Try it for free
Use OpenHabitTracker in your browser
No install needed - the PWA keeps all data on your device. Or get the native app:
Android - Google Play:
iOS - App Store:
Windows - Microsoft Store:
macOS - Mac App Store:
Linux - Flathub:
Linux - Snap Store:
Questions? The source is on GitHub and the community is on Reddit.